According To Our ForFarmers

The CMA’s write-up of its Phase 1 decision regarding the joint venture between Forfarmers and Boparan raises several important points relevant to parties assessing merger control prospects, including :

  1. It cannot be assumed that the CMA will use the same travel distances for catchment areas as in previous cases that the parties think are similar
  2. Local share of supply thresholds can form the SLC decision rule (rather than a trigger for further analysis) – even in cases where the number of local areas for consideration is small
  3. The level of the share of supply thresholds used to determine SLC (in this case 35% + 5%) depends on the facts of the case – for example, whether rivals have spare capacity.

The CMA identified horizontal and vertical competition concerns.

The deal has been abandoned shortly after reference to a Phase 2 investigation.

How The CMA Merger Numbers Are Made Up

There’s been a big overall decline in the percentage of CMA cases cleared unconditionally (at Phase 1 or Phase 2)* in recent years.

It’s been much commented on and interpreted.

But it’s not quite what it seems when you look behind the headline numbers.There are very different patterns when looked at by case type.

In fact, arithmetically at least, the aggregate change is accounted for by just one type of case.

Here’s the overall pattern for 2019 and 2020 cases, with the size of the different elements proportional to the number of outcomes in each category – where

  • green = unconditional clearance at Phase 1 or 2
  • yellow = remedies at Phase 1 or 2
  • red = prohibited or abandoned …….

Source: Adrian Payne analysis of published CMA decisions

It illustrates how important it can be to look behind the aggregate numbers when considering past or potential case outcomes and when interpreting ‘trends’ in the aggregrate numbers.

In one of my next Merger Insight briefings I’m going to be discussing the reasons behind these patterns and what they mean for companies planning mergers.

—————————————————————————————

(* Percentage of publically-investigated cases. Takes no account of cases the CMA chooses not to investigate publically, on which no meaningful data are published.)

———————————————————————————————

Thank you for reading. If you found the article informative please feel free to share it using the sharing buttons nearby.

The Surprising UK Share Of Supply Test

Surprise, surprise

Why are so many companies surprised to find their mergers investigated by the CMA?

It’s partly down to the elasticity with which the CMA exercises its ‘share of supply’ jurisdictional test.

Over the past year of two I have featured some persuasive articles on this in my UK Merger Spotlight.

Perspective

It’s important, however, to keep a sense of perspective:

The share of cases examined under the share of supply test is well towards its CMA low, as the diagram here shows.

Growing Unease

Maybe there are other reasons why unease among merging companies and their advisers has been growing about ‘share of supply’ cases?

Here are three:

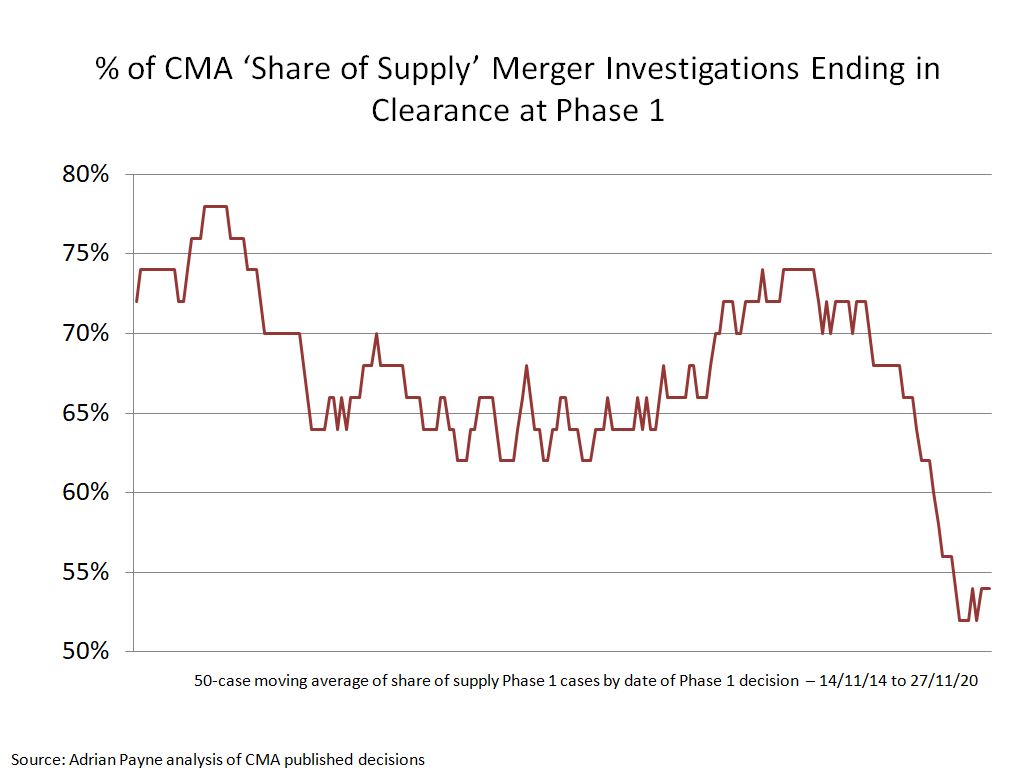
  1. Collapse in Phase 1 ‘share of supply test’ clearances

As the following diagram shows, since mid-2019 the proportion of ‘share of supply’ cases cleared at Phase 1 has nose-dived.

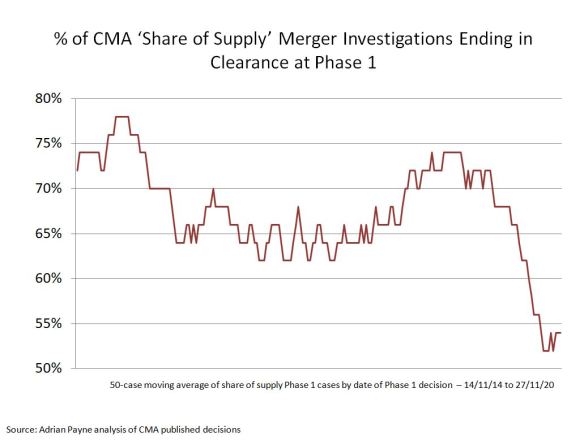
By contrast, the proportion of clearances among cases investigated under the CMA’s £70m turnover test has continued to climb – up to a CMA record of nearly 75%.

2. More referrals of ‘share of supply’ cases for in-depth Phase 2 investigation

The proportion of ‘share of supply’ cases referred for a Phase 2 investigation during the second half of the CMA’s case portfolio has been double what it was in the first half. (Meanwhile the proportion for ‘turnover test’ cases has stayed about the same).

3. Worsening outcomes at Phase 2 for ‘share of supply’ cases

The proportion of ‘share of supply’ cases cleared at Phase 2 has also dropped sharply between the two periods (though here there has also been a smaller but significant drop in the proportion of turnover test cases cleared at Phase 2).

In 2020, these three developments have culminated in

  • ‘Share of supply’ cases accounting for three quarters of the Phase 2 investigations completed to date
  • Just one clearance  among these ‘share of supply’ Phase 2 cases and
  • Over half prohibited by the CMA or abandoned by the parties.

So What?

1. Increases pressure for change

Well, for a start, the ‘share of supply’ case outcomes may explain some of the current criticism of the UK’s ‘voluntary’ notification regime.

Some would like the UK to move to a more ‘mandatory’ notification regime, with no share of supply test or with a share test that gives the CMA much less discretion. (It would, of course, be ridiculous to think that some such calls might also have anything to do with views on Brexit !)

2. Demonstrates the contribution of the ‘share of supply’ test

Second, the figures bring home how important the ‘share of supply’ test has been and continues to be to the UK merger control regime.

There is considerable onus therefore on those who advocate change to show how the contribution that the ‘share of supply’ test has made to the protection of UK consumers can be preserved or enhanced in any new system without adding unduly to the burden on merging parties or the taxpayer.

3. Provides important lessons for merging firms

And finally, for companies who may be considering merger in coming months the figures show how important it will be to take ‘share of supply’ test considerations fully into account in assessing UK merger control risk.

On this point it’s worth noting too that over a third of ‘share of supply’ cases examined so far this year were selected for investigation by the mergers intelligence function (a much higher proportion than for turnover test cases).

Especially in the new post-Brexit environment it is important for companies – even those with limited activities in the UK – to consider more carefully whether the CMA might take an interest in their deal, even where potential grounds for that interest might not be immediately obvious.

If that happens maybe the ‘share of supply’ test will spring fewer surprises in 2021 ?


In January 2021 I will be running a Merger Insight briefing discussing:

”The Extra Questions Merging Companies Need To Ask About The UK Share Of Supply Test.”

Details will be posted here. Do drop me a line if you would like to register interest now.


Thank you for reading this article — I hope you enjoyed it. Please do share it far and wide — there are handy sharing buttons nearby.

Which mergers threaten competition?

The UK’s Competition and Markets Authority (CMA) has just celebrated its third anniversary since taking over from the Office of Fair Trading and Competition Commission.

It has now made competition decisions in nearly 200 Phase 1 merger cases, enough to be able to discern some of the key factors that have informed its decision-making.

One factor that some (though far from all) companies and investors think about in assessing the chances of merger clearance is how the CMA may view the share of supply that the merged company would have in the products and services in which they overlap.

The following share of supply heatmap shows the pattern of decisions to date:

Share of supply in CMA Phase 1 decisions*

(April 1st 2014 to March 31st 2017)

170402-Share of supply heatmap

The colours indicate the proportion of cases that the CMA has found to represent a ‘substantial lessening of competition’ (SLC) at Phase 1 – ranging from:

  • brightest green at 0%
  • up through the shades of green to middle yellow (circa 50%)
  • and on through orange to the deepest red (100%).

The figures underlying the heatmap are taken from the large number of Phase 1 CMA decisions that report the merging parties’ shares of supply in the markets on which those cases focus.

Three features of the map stand out:

  1. The very high proportion of SLC findings in cases where the party with the smaller share of supply has a share of 20% or more
  2. No SLC finding where the parties’ combined share of supply is below 40%
  3. The significant proportion of cases that are found not to threaten an SLC even where the parties have a high combined share of supply.  This is where many of the cases with the most interesting lessons for companies and investors reside.

In general, as one might expect, the proportion of SLC findings increases the higher the combined share of supply and the higher the percentage increment to the larger share.

Further detail is covered in my merger briefings, including:

  • How (and how not) to interpret the heatmap
  • The most insightful parts of the map
  • Disaggregation of results, for example
    • by decision-maker
    • sector patterns
    • time period
    • remedies versus reference versus ‘de minimis’
  • Other notable patterns in the CMA’s decisions to date.

There are not yet enough Phase 2 cases to give a meaningful picture for Phase2.


* The share of supply heatmap is copyright Adrian Payne, 2017. The heatmap can be quoted and reproduced with the appropriate attribution.