Basement Clearances

This is the third of my posts looking back at UK merger control in 2022……….

The first looked at the low overall number of cases and the second at the near disappearance of so-called ‘de minimis’ cases.

In this post I look at Phase 1 clearance cases.

Here are the figures for Phase 1 clearance cases (in which I include ‘de minimis’ decisions)…

Four points stand out –

1.In 2022 there were just 20 Phase 1 published decisions that reported unconditional clearance, by far the lowest under the CMA.

2. And most of these were in the first half of 2022. The second half saw only 7.

3. It is the fourth successive annual fall and a sharp drop from 2021.

4. And the first year that fewer CMA Phase 1 published decisions reported clearance than did not.

Which all begs the question – Where have the clearance cases gone?

More on this in future posts………..

Much De Minished

Continuing my look back at 2022….

One of the features of the very low number of cases in 2021 and 2022 is the tiny number of cases considered for application of the ‘de minimis’ (low market size) exception to the CMA’s duty to refer.

In simple terms this exception enables the CMA to decide that it is not worth taking further action against mergers where an investigation has shown that competition problems may arise but where the size of the markets involved and/or the effects of the competition harm are too small to justify a reference to an in-depth Phase 2 investigation

In 2021 and 2022 I am aware of only one case in each year where ‘de minimis’ was considered in a public investigation – and accepted in both cases.

In the CMA’s early years between six and nine were considered in each year, with many being unsuccessful.

It is true that, in 2017, the CMA increased the market size below which it would be likely to exercise the exception.

This inevitably takes some cases out of the CMA’s reach (by my calculation, perhaps about half of them at the original thresholds).

But it also shifted the lower de minimis boundary upwards, meaning that cases that would once not have qualified for de minimis treatment, now do so.

So where are these cases?

Perhaps there simply haven’t been many in recent times and they will reemerge in due course.

Perhaps the CMA’s Merger Intelligence Committee has paid them less attention than before.

Or maybe more are now being dealt with through the CMA’s non-public briefing paper system , under which – since 2016 – merging parties have been able to submit a short paper to the CMA setting out why the CMA should not formally investigate the deal.

If there were, say, 50-100 briefing paper cases during 2022, it would be quite plausible that 5-10 or so might feature de minimis aspects (though less clear why none would make it through to investigation).

In the absence of published data on the CMA’s briefing paper activity how likely is this scenario?

If you have views on this (or any of the above) do let me know, either in the comments box below or by dropping me a line.

A Low, A Low

Happy New Year everyone.

As we look forward to 2023, what better time to review some of the key features of UK merger control in 2022?

Let’s start with the number of cases. (In coming posts I’ll look at other aspects).

Here’s my calculation of the number of Phase 1 published decisions by year (excluding those cases that were investigated but failed to meet the jurisdiction thresholds and national security-driven cases):

201462
201570
201660
201761
201855
201958
202047
202140
202241

The headline point is clear: the number of published Phase 1 decisions remained near its record low in 2022, despite the UK taking on responsibility for more merger cases after leaving the EU. Some predicted a big increase in the CMA’s caseload as a result.

A number of factors are relevant here, including:

  • Deal numbers – still affected by pandemic-related disruption
  • The type of deals being done
  • How selective the CMA is in the deals it chooses to investigate

What’s your view on the balance between these?

Do feel free to post your comments in the box below.

How The CMA Merger Numbers Are Made Up

There’s been a big overall decline in the percentage of CMA cases cleared unconditionally (at Phase 1 or Phase 2)* in recent years.

It’s been much commented on and interpreted.

But it’s not quite what it seems when you look behind the headline numbers.There are very different patterns when looked at by case type.

In fact, arithmetically at least, the aggregate change is accounted for by just one type of case.

Here’s the overall pattern for 2019 and 2020 cases, with the size of the different elements proportional to the number of outcomes in each category – where

  • green = unconditional clearance at Phase 1 or 2
  • yellow = remedies at Phase 1 or 2
  • red = prohibited or abandoned …….

Source: Adrian Payne analysis of published CMA decisions

It illustrates how important it can be to look behind the aggregate numbers when considering past or potential case outcomes and when interpreting ‘trends’ in the aggregrate numbers.

In one of my next Merger Insight briefings I’m going to be discussing the reasons behind these patterns and what they mean for companies planning mergers.

—————————————————————————————

(* Percentage of publically-investigated cases. Takes no account of cases the CMA chooses not to investigate publically, on which no meaningful data are published.)

———————————————————————————————

Thank you for reading. If you found the article informative please feel free to share it using the sharing buttons nearby.

CMA Phase 2 Decisions: The Long And Short Of It

There is a lot of interest at the moment as to what governs extension of the CMA Phase 2 timetable and whether extension has been a ‘good or bad sign’ for merging parties.

In my latest Merger Insight briefing yesterday I therefore looked at the Phase 2 cases to date for which the CMA extended the timetable for review – usually by up to eight weeks.

Below is a key chart that informed the discussion.

From left to right it ranks the Phase 2 final outcomes in ascending order of the duration of the Phase 2 process.

Each case is coloured as follows:

  • Black – merger abandoned
  • Green – unconditional clearance
  • Orange – clearance with remedies
  • Red – prohibition

The chart rather explains itself….


About a third of Phase 2 investigations to date have been extended. With one or two exceptions these are concentrated in the right-hand third of the chart.

It’s immediately apparent therefore that the proportion of cases unconditionally cleared has been very low for extended cases – less than half that for cases that ran to the usual timetable.

However it’s not all bad news for parties involved in extended cases. Extension can lead the CMA to become comfortable with a relaxation of remedies proposed at the provisional findings stage and enable late-emerging evidence to be explored in full.

Even so – the fact remains that only just over one in five extended cases have ended up being cleared.

Or – to put it another way – over two-thirds of mergers that have been prohibited or remedied at Phase 2 have involved extended investigations.

The other talking point yesterday was the proportion mergers that parties have decided to abandon. But that’s a story for another day….


For details of my free Merger Insight briefings please click here.


More Merger Remedies Than Ever

The Competition and Markets Authority has just completed its fourth year.

One particular development stands out, looking at the pattern of outcomes among the 250+ CMA merger decisions since 2014….

More Phase 1 remedies: Fewer Phase 2 investigations

On average, the Competition and Markets Authority (CMA) has accepted between 3 and 4 more remedy outcomes each year at Phase 1 than the Office of Fair Trading (OFT) which had responsibility for Phase 1 mergers until 2014.

At first glance that increase doesn’t look significant…. until one considers that:

  • the average number of Phase 1 remedies under the OFT was only 5 in the first place and that
  • the CMA has been formally considering 30% fewer cases than did the OFT.

The number of references to Phase 2 is on average just over 3 lower each year than it was before the CMA took over responsibility for Phase 2 mergers from the Competition Commission.

Pre-CMA the average annual number of references was 11.

While there is not be a direct one-for-one relationship between the increased average number of remedies and the lower average number of references, a  link would not be too surprising given the CMA’s stated policy of resolving more cases at Phase 1.

Overall, the percentage of problematic Phase 1 cases resolved through Phase 1 remedies, rather than reference to Phase 2, has been more that a third higher in the CMA’s first four years than for any four-year period under the OFT.

What has been the change in the pattern of outcomes at Phase 2?

The reduction in the average number of Phase 2 cases under the CMA reflects, in order of scale of change:

  • fewer mergers being abandoned on reference to Phase 2
  • fewer Phase 2 clearances
  • the near elimination of Phase 2 prohibitions and
  • a lower number of Phase 2 remedy outcomes.

This is consistent with the notion that, if there is some link between more Phase 1 remedies and fewer references to Phase 2, it is the more ‘marginal’ and more ‘fragile’ that may have been most affected.

If so it means that some cases that might have been cleared at Phase 2 are undergoing merger remedies at Phase 1.

This may be one reason why the proportion of cases being unconditionally cleared at Phase 1 or at Phase 2 is sharply lower under the CMA than it was under the OFT. (Another is the CMA’s greater selectivity in which cases formally to investigate.)

How Are Companies Responding?

Judging from conversations during some of my recent merger briefing sessions ,some companies considering or implementing mergers are already paying much closer attention to the potential for a Phase 1 remedy outcome than used to be the case.

This includes thinking harder about the more expansive types of Phase 1 remedy that the CMA has shown itself prepared to consider and accept.

For some it also means attending more to how they shape and scope their transactions and how they measure the degree of merger control risk they are taking on.

There are plenty of lessons merging companies can learn from the CMA’s 34 Phase 1 remedy cases so far – the subject of one of my recent briefings.

In recent months the rate of remedied cases has come back somewhat from its peak. Looking ahead, it will be interesting to see, therefore, whether we have already reached ‘peak Phase 1 remedy’.


Which mergers threaten competition?

The UK’s Competition and Markets Authority (CMA) has just celebrated its third anniversary since taking over from the Office of Fair Trading and Competition Commission.

It has now made competition decisions in nearly 200 Phase 1 merger cases, enough to be able to discern some of the key factors that have informed its decision-making.

One factor that some (though far from all) companies and investors think about in assessing the chances of merger clearance is how the CMA may view the share of supply that the merged company would have in the products and services in which they overlap.

The following share of supply heatmap shows the pattern of decisions to date:

Share of supply in CMA Phase 1 decisions*

(April 1st 2014 to March 31st 2017)

170402-Share of supply heatmap

The colours indicate the proportion of cases that the CMA has found to represent a ‘substantial lessening of competition’ (SLC) at Phase 1 – ranging from:

  • brightest green at 0%
  • up through the shades of green to middle yellow (circa 50%)
  • and on through orange to the deepest red (100%).

The figures underlying the heatmap are taken from the large number of Phase 1 CMA decisions that report the merging parties’ shares of supply in the markets on which those cases focus.

Three features of the map stand out:

  1. The very high proportion of SLC findings in cases where the party with the smaller share of supply has a share of 20% or more
  2. No SLC finding where the parties’ combined share of supply is below 40%
  3. The significant proportion of cases that are found not to threaten an SLC even where the parties have a high combined share of supply.  This is where many of the cases with the most interesting lessons for companies and investors reside.

In general, as one might expect, the proportion of SLC findings increases the higher the combined share of supply and the higher the percentage increment to the larger share.

Further detail is covered in my merger briefings, including:

  • How (and how not) to interpret the heatmap
  • The most insightful parts of the map
  • Disaggregation of results, for example
    • by decision-maker
    • sector patterns
    • time period
    • remedies versus reference versus ‘de minimis’
  • Other notable patterns in the CMA’s decisions to date.

There are not yet enough Phase 2 cases to give a meaningful picture for Phase2.


* The share of supply heatmap is copyright Adrian Payne, 2017. The heatmap can be quoted and reproduced with the appropriate attribution.


2015/16: A Record Year For UK Merger Control

This post looks at the pattern of merger control decisions during the Competition and Markets Authority’s (CMA’s) second full year, which ended on March 31st. The decisions covered are those for which final decisions were published during the year.

In summary:

2015/16 turns out to have been a record-breaking year in many different respects

  1. A record low number of Phase 1 merger decisions

The 62 published CMA Phase 1 decisions was the lowest number of any year since the Enterprise Act came into force and well down on 2015/16.

A third successive sharp drop in the number of non-notified mergers that the CMA ‘called in’ for investigation contributed to the fall. Only 10 cases were called in, the lowest number I can recall for any year. Another record.

Phase 1 Merger Decisions – 2015/16 compared to previous years

160406-phase 1 figures 15-16

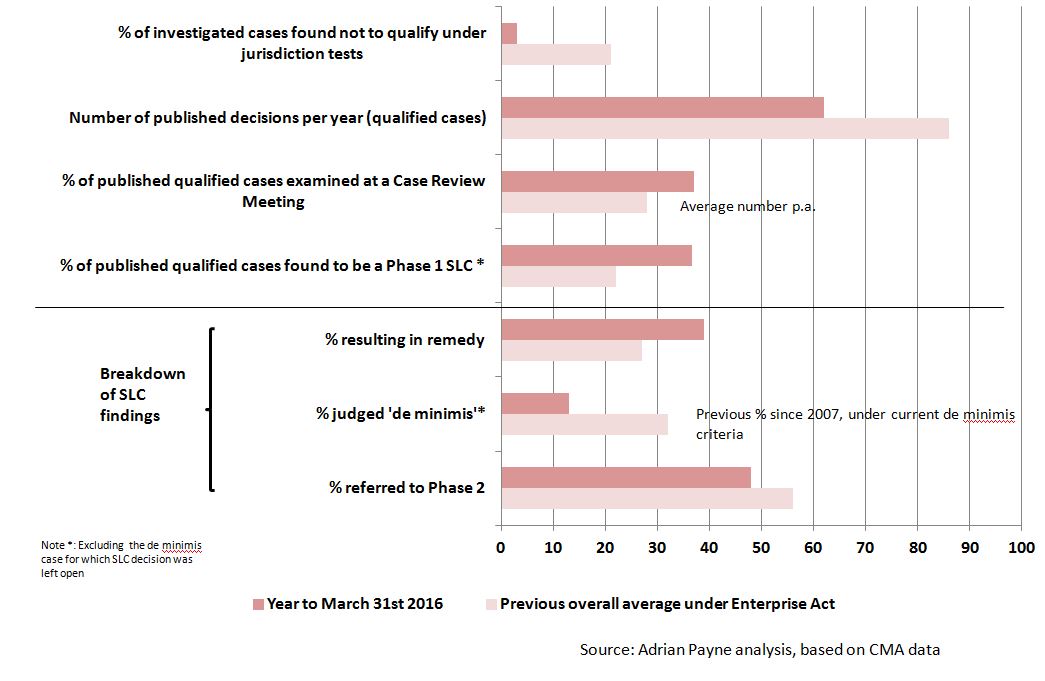
2. A record low number of decisions was found not to meet the jurisdiction criteria

The number and proportion of published cases found not to meet the qualifying tests for jurisdiction was in 2015/16 a fraction of its historic average – and by far the lowest in any year so far under the Enterprise Act.

3. Phase 1 competition problems at a record high

The proportion of Phase 1 cases meeting the jurisdiction tests (so-called ‘qualified cases’) that was found to threaten a ‘substantial lessening of competition’ (SLC) doubled compared to the CMA’s first year and reached a record high of 38%.

There are two elements to this that are worth noting:

  • Cases that are candidates for a Phase 1 SLC decision are examined in detail at a so-called ‘Case Review Meeting’, late in the Phase 1 process. The proportion of cases taken to a Case Review Meeting was well above average in 2015/16.
  • And of those cases, over 80% resulted in an SLC finding – again well above average.
  1. The lowest ever proportion of cases decided at Phase 1

The proportion of qualified cases decided at Phase 1 was the lowest to date under the Enterprise Act.

This result stems from the fact that, even though the proportion of problematic cases referred to Phase 2 for further investigation was well below average, the percentage of problematic cases in the overall caseload was at a record high, as described above.

  1. The proportion of problematic Phase 1 cases deemed too small to merit a Phase 2 investigation was at a record low

This statistic relates to so-called ‘de minimis’ cases. It is a great example of how one needs to look at individual cases (both notified and un-notified) in order to interpret the result.

Might it indicate that the CMA is taking a harder line on arguments put to it that a case is too small to warrant further investigation? Or does it show that the CMA is calling in fewer potential ‘de minimis’ cases? Cases strongly favour the latter.

6. A record high for Phase 1 remedies

The proportion of problematic cases dealt with by remedies at Phase 1 rose to a record high of nearly 40% in 2015/16.

It is striking that, at one point during the year, seven out of ten consecutive SLC decisions (excluding de minimis cases and automatic references) were dealt with through Phase 1 remedy rather than reference to Phase 2, another record under the Enterprise Act as far as I recall.

It is interesting that this is in the context of there being….

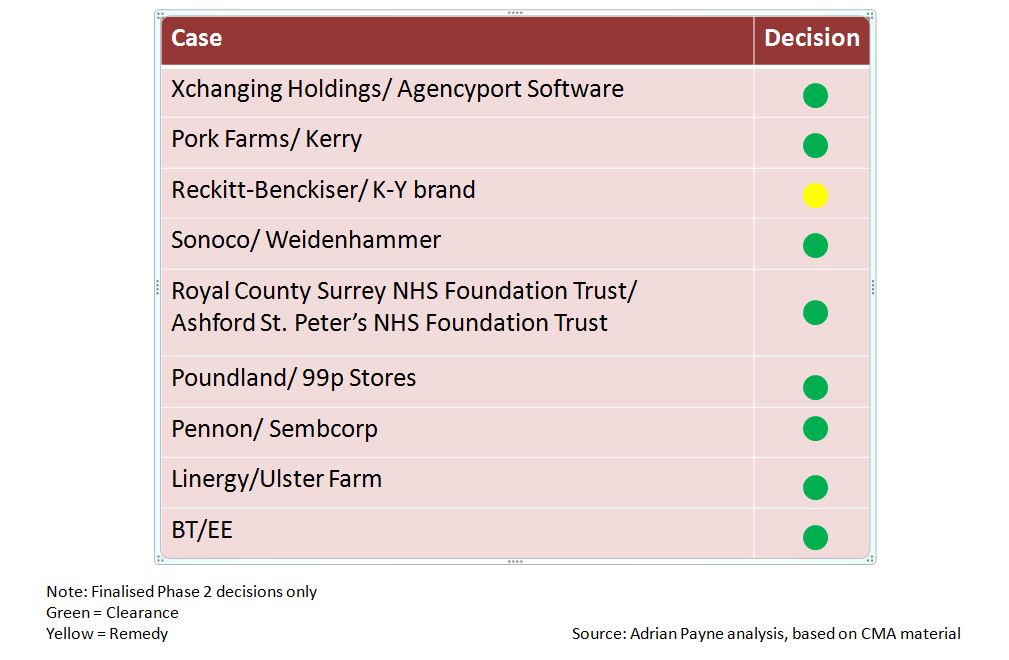
7. No Phase 2 prohibitions for the second consecutive year.

This means that the CMA Phase 2 decision-makers have yet to prohibit a merger.

There have, however, been two previous occasions in which there have been no prohibited mergers for two consecutive years. So this one isn’t a record !

2015/16 – CMA Final Phase 2 Merger Decisions

160406-phase 2 decisions 15-16

Looking ahead

Where does this cascade of new merger records leave the CMA, merging firms, competitors and customers?

There is little doubt that the CMA has become increasingly selective in the cases it has chosen to call in for investigation, to a degree that requires highly reliable information being available from merging parties in order to enable the CMA to avoid missing too many problematic deals of reasonable size.

The particular challenge here for the CMA is to make these ‘call in’ decisions accurately and quickly outside of the formal review process, without the range and quality of cross-checks that comes from interaction with competitors and customers when a case is called in for review.

As some have already recognised, for merging parties greater CMA selectivity is clearly relevant to decisions regarding notification. A key question, therefore, is whether the CMA will decide to be as selective in the year ahead. It is worth remembering here that there has already been more than one occasion under the Enterprise Act when tighter case selection has been followed by a move back to a more expansive approach to calling in cases for review.

For customers and competitors greater CMA case selectivity clearly puts a premium on making representations more quickly, rather than waiting for a formal investigation to begin. The much-expanded role for pre-notification also points in this direction, as does the earlier involvement of the Phase 1 decision-maker than used to be the case.

Turning to substantive decisions made during 2015/16 , as the National Audit Office recently put it, “the CMA is expanding the practice of clearing cases with remedies in phase 1 without the need to go for a more detailed and resource-intensive phase 2 review.”

It would be easy, however, to overstate the extent to which the 2015/16 remedies record is due to the CMA’s expanded Phase 1 remedy ambitions. In particular, the increasing level of challenge in many deal valuations (a factor in the low number of deals) seems to me to have had a notable effect on the appetite for regulatory risk and therefore the pattern of deals being brought to fruition (including their suitability for Phase 1 remedies).

Two other questions are also relevant here:

  • To what extent has the way in which CMA plans and manages its casework (now that Phase 1 and Phase 2 are under one roof) affected the pattern of Phase 1 decisions being made?
  • And what has been the impact of certain ‘bold’ Phase 2 clearance decisions on the attitude to remedies at Phase 1, both by parties and by the CMA?

On the whole, my own 2015/16 casework leads me strongly to suspect that the CMA’s record-breaking year for mergers hides patterns that are more complicated than they first appear from the aggregate statistics.

As always, many of the main lessons for interested parties to future mergers come from understanding what has worked well or badly in individual cases during 2015/16, as well as from understanding what the aggregate figures do and do not show.

In both respects 2015/16 should leave plenty of pause for thought for all concerned.

——————————————————-

© Adrian Payne, 2016

CMA merger decisions : another bunch of fives

150119-bunch of fivesJust when some companies thought it was becoming safer to merge the Competition and Markets Authority has found competition problems with five mergers …..

..  in just six weeks

(These relate to Phase 1 merger cases requiring further Phase 2 investigation, or undertakings to resolve the problems, for which decisions were announced between December 1st 2014 and January 15th 2015)

This after the CMA identified just four problematic deals at Phase 1 during the whole of 2014 up to the beginning of December (excluding cases deemed too small to justify a Phase 2 investigation).

What should companies currently contemplating difficult deals make of this recent bunch of five?

As always with short sequences of merger decisions it is vital to take a long view and to avoid the temptation to read too much into too few decisions.

So what does the long view look like?

The history of Phase 1 decisions under the 10+ years of the Enterprise Act helps put things in perspective.

In actual fact the UK merger authorities have delivered several speedy bunches of five over the years….2006, 2011 and 2012 each contained six-week periods in which five mergers were found to raise competition concerns at Phase 1.

And those episodes are by no means the record.

In early 2005 there was a similar period when seven deals fell foul of the then-OFT’s decision-makers. And later that same year eight deals were found to be problems in just over a month.

What is more, this number of five-plus/six-week bunches over the years is more or less exactly what one would expect given the average number of cases each year and the average probability of a case giving rise to an adverse competition finding.

And, not to forget that the latest Christmas/New Year decision-making flurry followed an influx of new cases in October that numbered well above average. Perfect timing for a bumper seasonal delivery of merger decisions.

So while it is true that a bunch of fives from the UK’s merger authorities hasn’t happened that often, it is also the case that it has not been that unusual either.

No need for companies to worry unduly yet about the latest bunch of fives.

————————————————————————————————–

© Adrian Payne 2015


2014 in Numbers : An Overview of UK Merger Control

150101-Number picture0  – The number of new merger prohibition decisions

1  – The number of appeals to the Competition Appeals Tribunal

3  – The number of Phase 2 decisions – all clearances

4  – The number of Phase 1 cases that investigated coordination between firms

5   –  The number of rail franchise cases examined

  –  The percentage of cases in which merger efficiencies or customer benefits were examined in some detail

13  –  The number of cases opened in August, the peak month of the year for new cases

16  –  The percentage of cases found not to qualify for investigation under the tests for jurisdiction

18  – The percentage of qualifying cases found to result in a substantial lessening of competition at Phase 1

19  – The percentage of cases in which parties argued that one of the businesses involved would exit if the merger did not proceed

20  – The percentage of cases qualifying for investigation under the turnover test

21  – The number of Phase 1 cases involving ‘vertical’ theories of harm

33 – The number of opened Phase 1 cases being investigated at the peak month-end of the year – October

45  – The percentage of cases involving completed deals

50  – The percentage of cases found to harm competition that were referred for Phase 2 investigation

53  – The percentage of cases in which one or more competitors to the merging parties expressed concerns about the deal

54  – The percentage of cases that investigated more than one theory of harm to competition

59 – The percentage of cases in which one or more customers of the parties expressed concerns about the deal

60  – The smallest share of supply for the parties to those deals found to harm competition

78  – The number of pages in the longest Phase 1 decision

82  –  The number of Phase 1 decisions announced

90  – The highest percentage share of supply of one of the parties to a merger that was cleared at Phase 1

6,500,000  – The size (in pounds) of the largest market deemed too small to justify a Phase 2 investigation (under the de minimis criteria)

———————————————————————————————————

Note: Numbers refer to those OFT, CC and CMA cases for which the decisions were announced during 2014 and for which relevant details were published as at 31/12/14.

© Adrian Payne 2015