CMA merger decisions : another bunch of fives

150119-bunch of fivesJust when some companies thought it was becoming safer to merge the Competition and Markets Authority has found competition problems with five mergers …..

..  in just six weeks

(These relate to Phase 1 merger cases requiring further Phase 2 investigation, or undertakings to resolve the problems, for which decisions were announced between December 1st 2014 and January 15th 2015)

This after the CMA identified just four problematic deals at Phase 1 during the whole of 2014 up to the beginning of December (excluding cases deemed too small to justify a Phase 2 investigation).

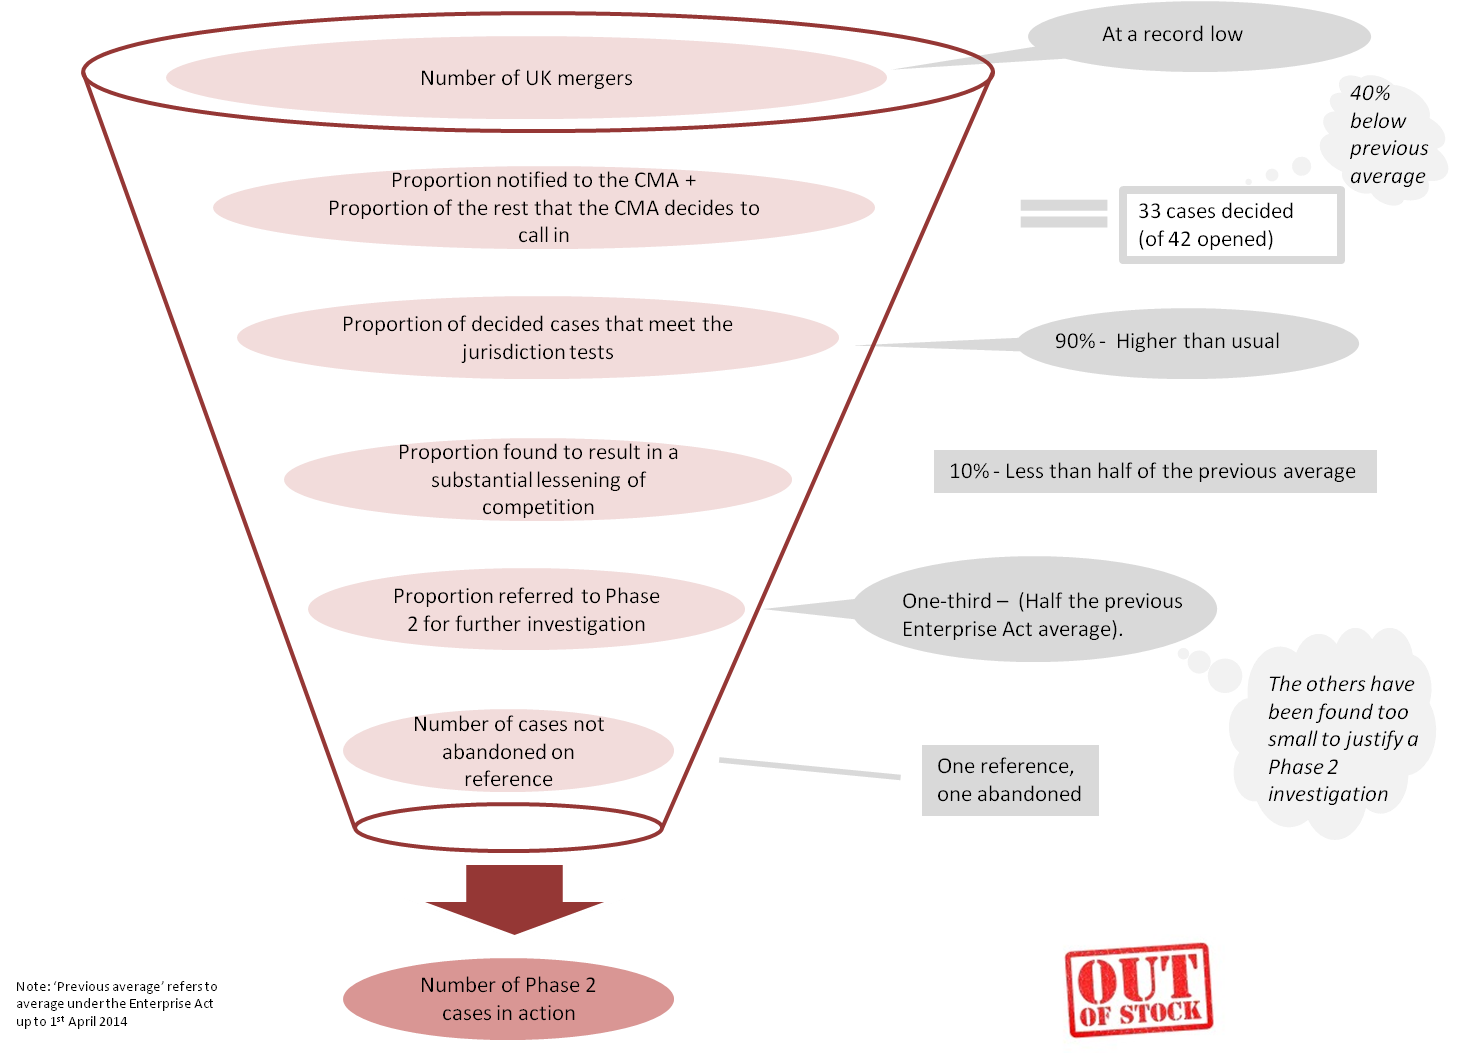
What should companies currently contemplating difficult deals make of this recent bunch of five?

As always with short sequences of merger decisions it is vital to take a long view and to avoid the temptation to read too much into too few decisions.

So what does the long view look like?

The history of Phase 1 decisions under the 10+ years of the Enterprise Act helps put things in perspective.

In actual fact the UK merger authorities have delivered several speedy bunches of five over the years….2006, 2011 and 2012 each contained six-week periods in which five mergers were found to raise competition concerns at Phase 1.

And those episodes are by no means the record.

In early 2005 there was a similar period when seven deals fell foul of the then-OFT’s decision-makers. And later that same year eight deals were found to be problems in just over a month.

What is more, this number of five-plus/six-week bunches over the years is more or less exactly what one would expect given the average number of cases each year and the average probability of a case giving rise to an adverse competition finding.

And, not to forget that the latest Christmas/New Year decision-making flurry followed an influx of new cases in October that numbered well above average. Perfect timing for a bumper seasonal delivery of merger decisions.

So while it is true that a bunch of fives from the UK’s merger authorities hasn’t happened that often, it is also the case that it has not been that unusual either.

No need for companies to worry unduly yet about the latest bunch of fives.

————————————————————————————————–

© Adrian Payne 2015


2014 in Numbers : An Overview of UK Merger Control

150101-Number picture0  – The number of new merger prohibition decisions

1  – The number of appeals to the Competition Appeals Tribunal

3  – The number of Phase 2 decisions – all clearances

4  – The number of Phase 1 cases that investigated coordination between firms

5   –  The number of rail franchise cases examined

  –  The percentage of cases in which merger efficiencies or customer benefits were examined in some detail

13  –  The number of cases opened in August, the peak month of the year for new cases

16  –  The percentage of cases found not to qualify for investigation under the tests for jurisdiction

18  – The percentage of qualifying cases found to result in a substantial lessening of competition at Phase 1

19  – The percentage of cases in which parties argued that one of the businesses involved would exit if the merger did not proceed

20  – The percentage of cases qualifying for investigation under the turnover test

21  – The number of Phase 1 cases involving ‘vertical’ theories of harm

33 – The number of opened Phase 1 cases being investigated at the peak month-end of the year – October

45  – The percentage of cases involving completed deals

50  – The percentage of cases found to harm competition that were referred for Phase 2 investigation

53  – The percentage of cases in which one or more competitors to the merging parties expressed concerns about the deal

54  – The percentage of cases that investigated more than one theory of harm to competition

59 – The percentage of cases in which one or more customers of the parties expressed concerns about the deal

60  – The smallest share of supply for the parties to those deals found to harm competition

78  – The number of pages in the longest Phase 1 decision

82  –  The number of Phase 1 decisions announced

90  – The highest percentage share of supply of one of the parties to a merger that was cleared at Phase 1

6,500,000  – The size (in pounds) of the largest market deemed too small to justify a Phase 2 investigation (under the de minimis criteria)

———————————————————————————————————

Note: Numbers refer to those OFT, CC and CMA cases for which the decisions were announced during 2014 and for which relevant details were published as at 31/12/14.

© Adrian Payne 2015


Mergers at the CMA: What’s Up?

The Competition and Markets Authority completed its first six months of cases at the end of September.

Since mid-August it has been in the unusual position (as compared with its predecessor, the Competition Commission) of having no Phase 2 merger cases to consider.

As one FD put it to me last week: “What’s up at the CMA? –  I thought there has been a merger boom going on”

Well, actually, in the UK there hasn’t !…………. (as the latest official statistics show).

There are in fact several different elements to the answer, as the following picture shows.

Figure 1: UK Mergers: April 1st to September 30th 2014

141006-merger-funnel

On the face of it some of these figures appear very striking.

No wonder some competition practitioners are already talking of a significant change of approach by the CMA, compared to its predecessor agencies.

Indeed change would not be at all surprising because:

  1. New timetables and procedures are revising what is possible at Phase 1 (including pre-notification) in some cases.
  2. Putting Phase 1 and Phase 2 into a single organisation gives incentives to optimise resources across the two phases that did not exist when the OFT and Competition Commission were separate agencies.

But, not so fast….

….whatever changes do eventually emerge, there is a real danger of drawing premature conclusions.

Six months of case data is far too short a period from which to infer changes in underlying trends. And bear in mind that the number of cases involved at the lower end of the funnel is small.

Looking at the individual cases involved and comparing them with previous years, it is just as likely that the six month figures reflect the mix of cases in terms of sector, size and the pattern of competition issues raised.

With this in mind it is worth remembering that many of the parameters in the ‘funnel’ shown above can and do vary widely from year to year.

To take just one example: the following chart shows how the proportion of qualified cases (i.e. those that have met the jurisdictional criteria) found to raise competition problems at Phase 1 has varied since the Enterprise Act came into force. The latest year’s figure is in fact not much lower than for six of the previous ten years.

Figure 2: Phase 1 ‘Substantial Lessening of Competition’ findings as a proportion of qualified merger cases

141003-SLC per cent

I’ll be returning to this subject in a future article so do drop me a line if you have thoughts.

In the meantime, with eleven Phase 1 decisions due for announcement over the next six weeks, the picture could change rapidly.

Then again…..


——————————————————————————————————————–

Click here for the latest UK merger control statistics.

My article on the one CMA merger reference so far is here.

My ‘A-Z of 2014 UK Merger Analysis’ presentations are taking place in January. Please get in touch if you are interested in arranging one for your firm.